
קובץ:Anscombe.svg

לקובץ המקורי (קובץ SVG, הגודל המקורי: 945 × 630 פיקסלים, גודל הקובץ: 57 ק"ב)
| זהו קובץ שמקורו במיזם ויקישיתוף וניתן להשתמש בו גם במיזמים אחרים. פרטי הקובץ שמופיעים למטה נלקחו מדף תיאור הקובץ המקורי. |
תקציר
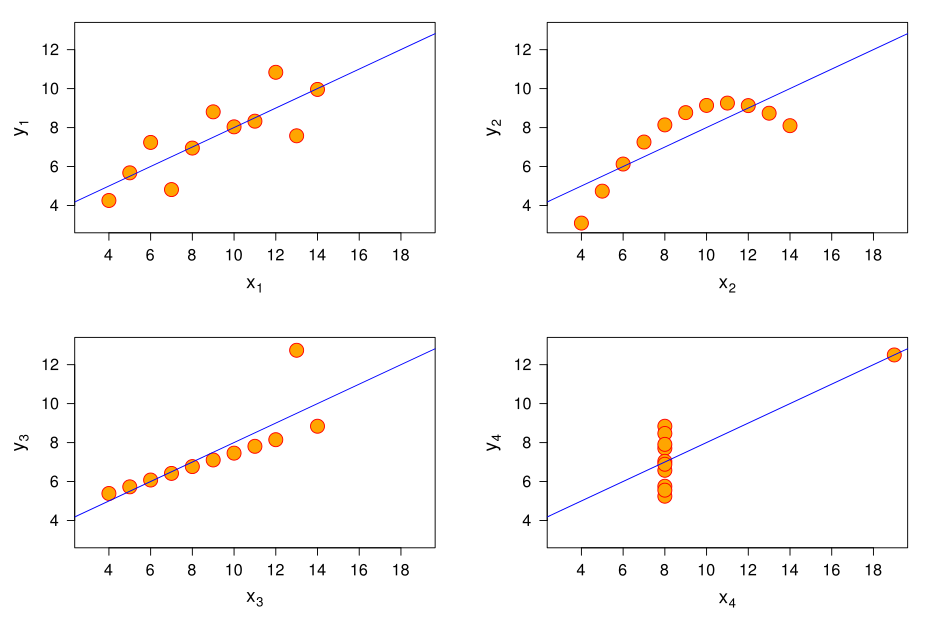
This graphic represents the four datasets defined by Francis Anscombe for which some of the usual statistical properties (mean, variance, correlation and regression line) are the same, even though the datasets are different.
| Property | Value |
|---|---|
| Mean of each variable | 9.0 |
| Variance of each variable | 11.0 |
| Mean of each variable | 7.5 |
| Variance of each variable | 4.12 |
| Correlation between each and variable | 0.816 |
| Regression line |


The graph was created by User:Schutz for Wikipedia on 13 June 2006 (and updated on 29 March 2010), using the R statistical project. The program that generated the graphic is given below; it is based on the example provided with the help page of the R dataset anscombe (accessible using the command data(anscombe); help and more information about the dataset is available using the command help(anscombe)), and was slightly modified to improve the result. The graph was directly exported in SVG format.
References:
- Anscombe, Francis J. (1973) Graphs in statistical analysis. American Statistician, 27, 17–21.
- R Development Core Team. R: A Language and Environment for Statistical Computing. R Foundation for Statistical Computing. Vienna, Austria. 2006. ISBN 3-900051-07-0. http://www.R-project.org
 svg("anscombe.svg", width=10.5, height=7)
 par(las=1)

 ##-- some "magic" to do the 4 regressions in a loop:
 ff <- y ~ x
 for(i in 1:4) {
   ff[2:3] <- lapply(paste(c("y","x"), i, sep=""), as.name)
   ## or   ff2 <- as.name(paste("y", i, sep=""))
   ##      ff3 <- as.name(paste("x", i, sep=""))
   assign(paste("lm.",i,sep=""), lmi <- lm(ff, data= anscombe))
 }

 ## Now, do what you should have done in the first place: PLOTS
 op <- par(mfrow=c(2,2), mar=1.5+c(4,3.5,0,1), oma=c(0,0,0,0),
           lab=c(6,6,7), cex.lab=1.5, cex.axis=1.3, mgp=c(3,1,0))
 for(i in 1:4) {
   ff[2:3] <- lapply(paste(c("y","x"), i, sep=""), as.name)
   plot(ff, data =anscombe, col="red", pch=21, bg = "orange", cex = 2.5,
        xlim=c(3,19), ylim=c(3,13),
        xlab=eval(substitute(expression(x[i]), list(i=i))),
        ylab=eval(substitute(expression(y[i]), list(i=i))))
   abline(get(paste("lm.",i,sep="")), col="blue")
 }

 dev.off()
רישיון
The R project is licensed under the GPL [1]; since this image is a derived work of an example script provided with R, it is also licenced under the GPL.
However, all modifications made by User:Schutz are also licensed under the CC-BY-SA licence.

|
היצירה הזאת היא תוכנה חופשית; ניתן להפיץ ו/או לשנות אותה לפי תנאי הרישיון הציבורי הכללי של GNU כפי שפורסם על־ידי המוסד לתכנה חופשית; או גרסה 2 של הרישיון, או כל גרסה עדכנית יותר. היצירה הזאת מופצת בתקווה שתביא תועלת, אך ללא כל אחריות שהיא; אפילו לא אחריות מרומזת לצורכי מסחר או התאמה למטרה מסוימת. יש לעיין בגרסה 2 ובגרסה 3 של הרישיון הציבורי הכללי של GNU לפרטים נוספים. |
Derivative works
Derivative works of this file:
היסטוריית הקובץ
ניתן ללחוץ על תאריך/שעה כדי לראות את הקובץ כפי שנראה באותו זמן.
| תאריך/שעה | תמונה ממוזערת | ממדים | משתמש | הערה | |
|---|---|---|---|---|---|
| נוכחית | 18:10, 29 במרץ 2010 | | 630 × 945 (57 ק"ב) | Schutz | |
| 03:07, 15 בינואר 2007 |  | 677 × 990 (88 ק"ב) | Schutz | ||
| 03:05, 15 בינואר 2007 |  | 677 × 990 (88 ק"ב) | Schutz | ||
| 00:37, 14 ביוני 2006 |  | 750 × 1,044 (94 ק"ב) | Schutz | ||
| 21:27, 13 ביוני 2006 |  | 875 × 1,125 (94 ק"ב) | Schutz |
שימוש בקובץ
הדף הבא משתמש בקובץ הזה:
שימוש גלובלי בקובץ
אתרי הוויקי השונים הבאים משתמשים בקובץ זה:
- שימוש באתר ca.wikipedia.org
- שימוש באתר da.wikipedia.org
- שימוש באתר en.wikipedia.org
- שימוש באתר es.wikipedia.org
- שימוש באתר eu.wikipedia.org
- שימוש באתר fi.wikipedia.org
- שימוש באתר fr.wikipedia.org
- שימוש באתר fr.wikiversity.org
- שימוש באתר hu.wikipedia.org
- שימוש באתר nl.wikipedia.org
- שימוש באתר nl.wiktionary.org
- שימוש באתר nn.wikipedia.org
- שימוש באתר no.wikipedia.org
- שימוש באתר ru.wikipedia.org
- שימוש באתר su.wikipedia.org
- שימוש באתר tr.wikipedia.org
- שימוש באתר uk.wikipedia.org
- שימוש באתר www.wikidata.org